
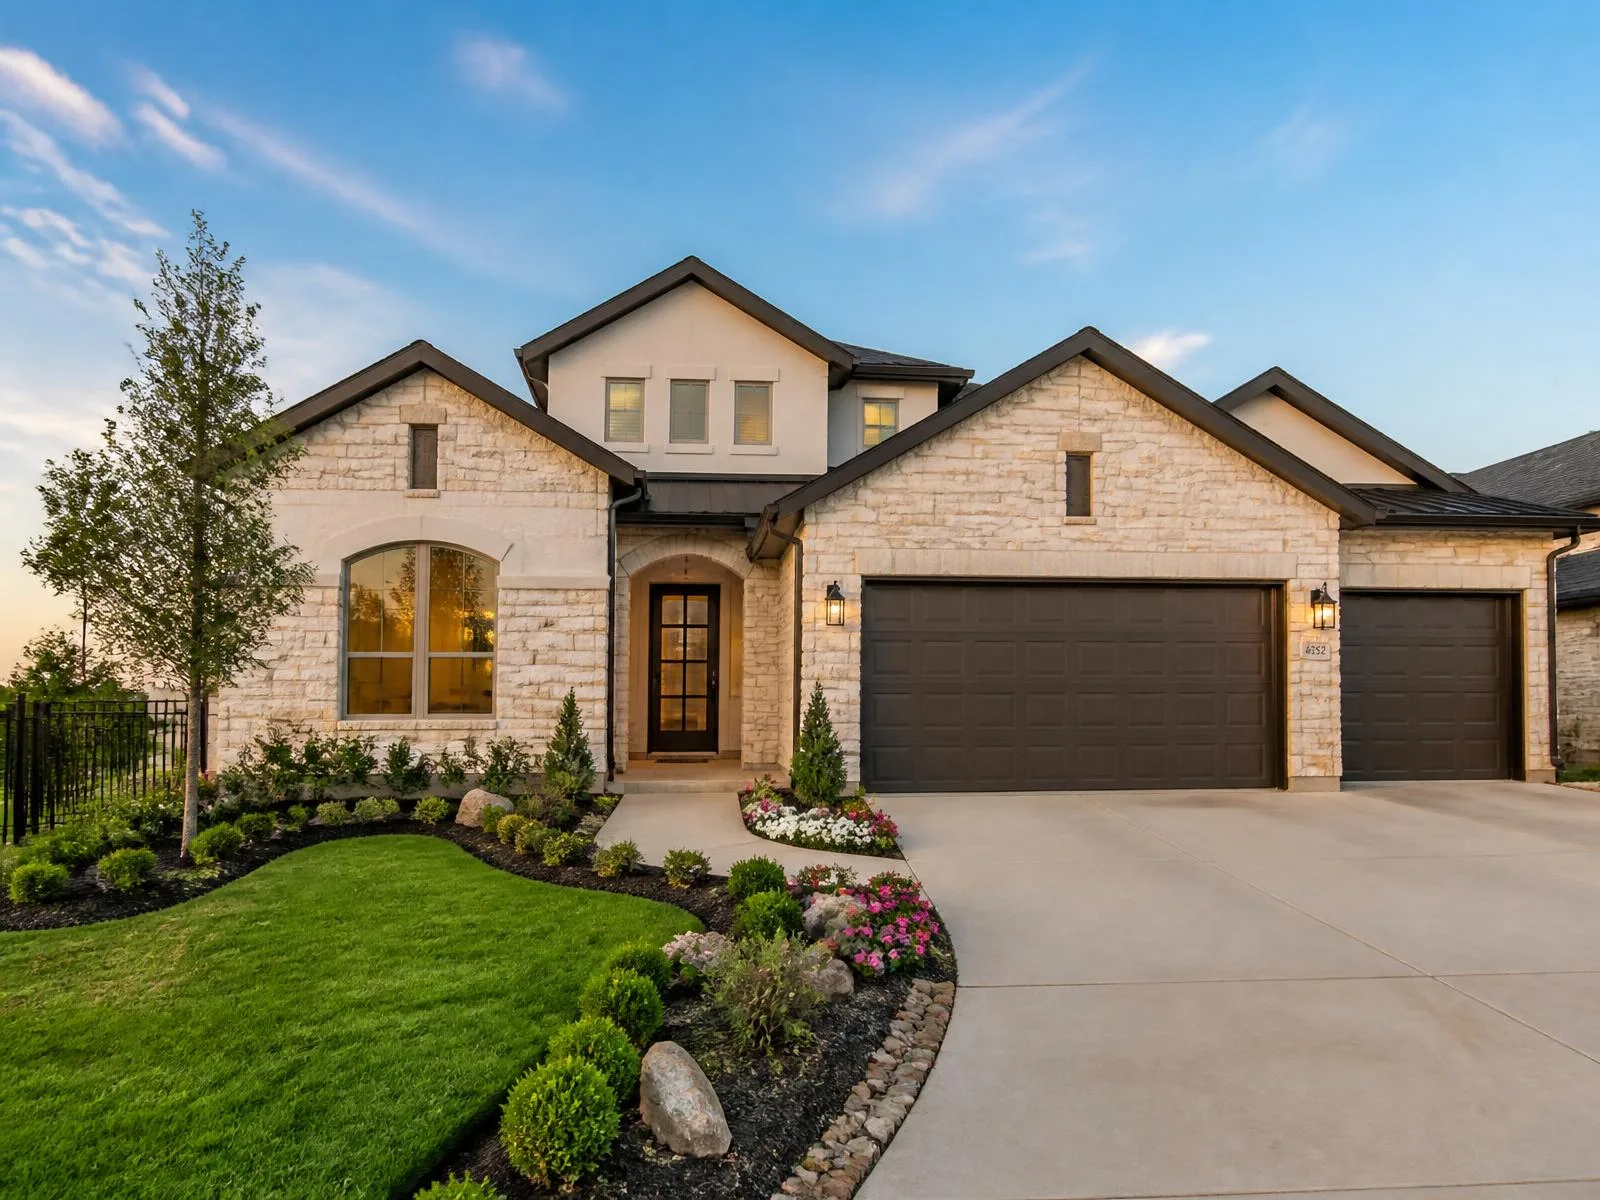
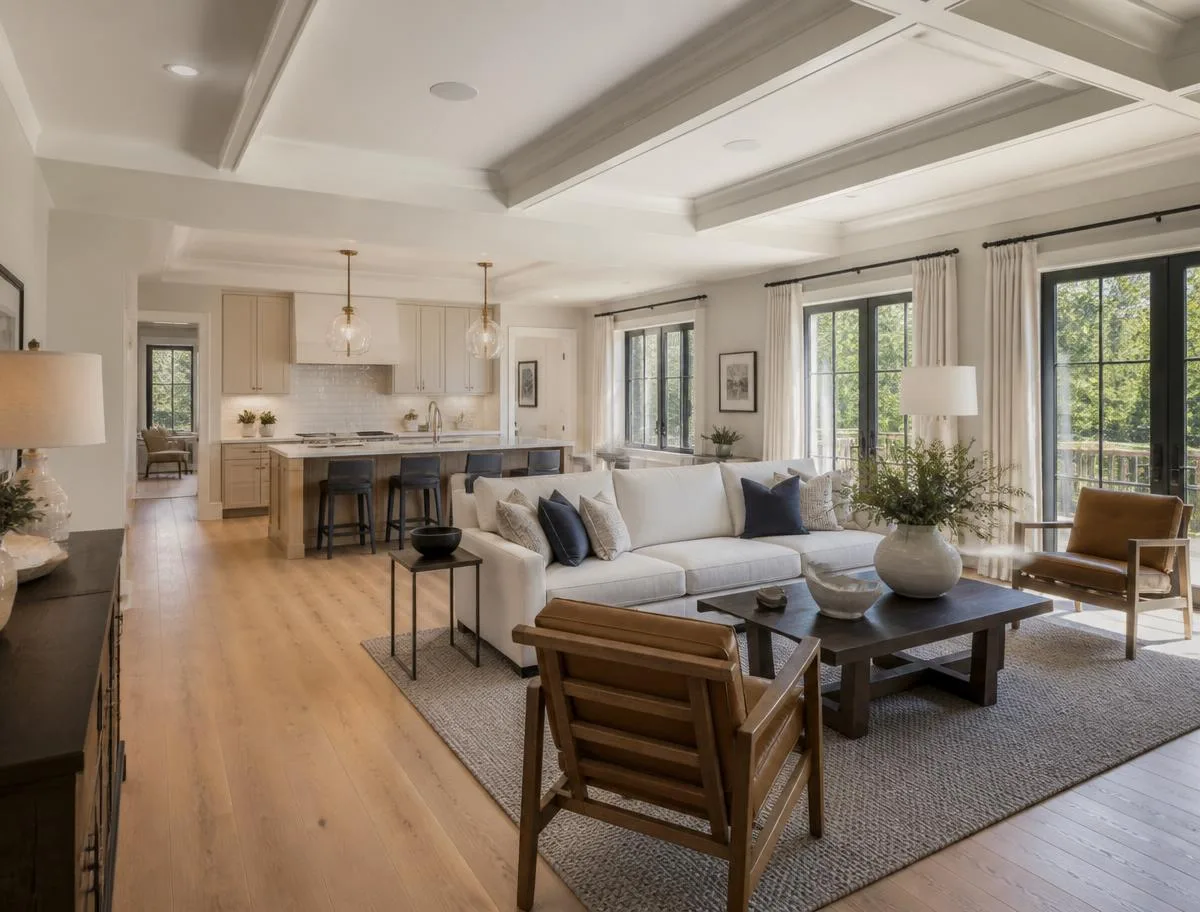
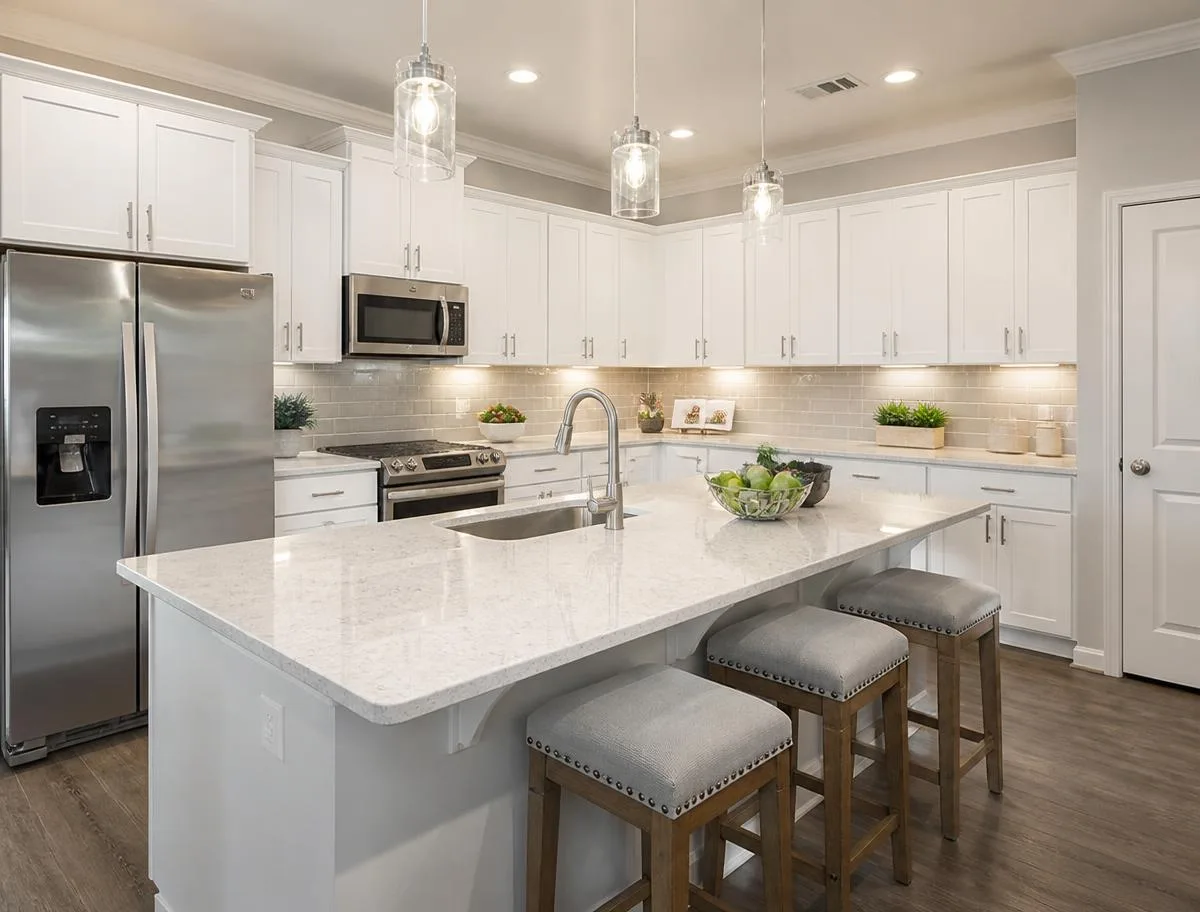
4-bed model leaseback in Highland Reserve
Highland Reserve · Wesley Chapel, FL 33543 · 24-month builder leaseback
4 beds · 3 baths · 2,648 sqft · built 2025 · Single-family detached — example
A brand-new decorated model in a 412-homesite community with 6 years of remaining build-out. The builder stays in place as tenant, maintaining the home as its on-site sales model and paying rent under a 24-month leaseback with escalation, then returns it in retail-ready condition.
Investment snapshot
The figures an investor screens on first, in one place — before opening the full pro forma.
- Purchase price
- $612,000
- Builder leaseback rent
- $4,150 / mo
- Lease term
- 24 months
- Contracted gross yieldContracted Gross Yield reflects annual builder leaseback rent divided by purchase price. Underwritten NOI Cap Rate reflects estimated net operating income divided by purchase price after applicable operating expenses (property tax, insurance, HOA, and any vacancy, management and maintenance allowances).
- 8.14%
- Underwritten NOI cap rateContracted Gross Yield reflects annual builder leaseback rent divided by purchase price. Underwritten NOI Cap Rate reflects estimated net operating income divided by purchase price after applicable operating expenses (property tax, insurance, HOA, and any vacancy, management and maintenance allowances).
- 6.30%
- Cash-on-cash returnAnnual cash flow after debt service divided by cash invested (down payment plus closing costs), at the default financing assumptions.
- 1.7%
- DSCRNet operating income divided by annual debt service. Lenders commonly look for 1.20 or better.
- 1.08
- Break-even rentMonthly rent required to cover operating expenses plus debt service at these assumptions.
- $3,914 / mo
Current builder leaseback rent
$4,150 / mo
Break-even rent
$3,914 / mo
Monthly cushion above break-even
$236 / mo
Snapshot figures use the same underwriting engine as the interactive pro forma below, at its default assumptions (25% down, 6.75% over 30 years). Adjust the inputs below to see your own numbers. Contracted Gross Yield reflects annual builder leaseback rent divided by purchase price. Underwritten NOI Cap Rate reflects estimated net operating income divided by purchase price after applicable operating expenses (property tax, insurance, HOA, and any vacancy, management and maintenance allowances).
Key takeaways
What this structure actually delivers, and where the sensitivity sits.
- 01
The builder lease contracts $4,150 per month for 24 months — a 8.14% contracted gross yield, which underwrites to a 6.30% NOI cap rate after estimated operating expenses of $11,238 per year.
- 02
Under a NNN-style builder lease the tenant typically covers maintenance, landscaping and utilities while the home serves as its sales model, which reduces day-to-day management during the term. Confirm the exact allocation in the executed lease.
- 03
Estimated residential market rent after the builder vacates is $3,700 per month — $450 per month below the builder rent. The post-lease period, not the lease term, sets the long-run yield.
- 04
DSCR is 1.08 at these financing assumptions and break-even rent is $3,914 per month, leaving $236 of monthly cushion. At the estimated post-lease rent the property would sit $214 per month below break-even. Debt-service coverage should be evaluated carefully rather than assumed.
- 05
Appraisal support for the purchase price and the model's upgrade premium is a primary diligence item — heavily optioned models can price above surrounding comparable sales, which affects both leverage and exit value.
Full pro forma
Adjust financing, taxes, and growth assumptions to see cash flow, cash-on-cash, DSCR, break-even rent, and a full hold-period projection.
Est. 10-year
annualized return
10.9%
2.81x equity multiple · $294,194 total profit
Estimated from the editable inputs below. Assumes a 10-year hold and 6% sale costs at exit.
Returns
- Underwritten NOI cap rate
- 6.30%
- Est. cash on cash
- 1.7%
- DSCR
- 1.08
- Contracted gross yield
- 8.14%
- Break-even rent
- $3,914 / mo
- Annual rental income
- $49,800
- Est. annual cash flow
- $2,837
- Net operating income
- $38,562
Contracted gross yield is annual builder leaseback rent ÷ purchase price. Underwritten NOI cap rate is estimated net operating income ÷ purchase price, after property tax, insurance, HOA and any vacancy, management and maintenance allowances set below. Break-even rent is the monthly rent needed to cover operating expenses plus debt service.
Acquisition costs
- Down payment & closing costs
- $162,180
- Total acquisition cost
- $621,180
Key expenses
- Annual HOA fee
- $1,140
- Est. annual operating expenses
- $11,238
- Monthly mortgage payment
- $2,977
- Mortgage amount
- $459,000
Break-even rent at these inputs
$3,914 / mo
Operating expenses plus debt service. Compare this to both the contracted builder rent and the market rent you expect after the builder vacates — the second number is what carries the property for most of the hold.
Figures are estimates based on your assumptions and builder-published numbers — not investment, tax, or legal advice.
Post-lease economics
What the property looks like once the builder vacates — and the three paths available at that point.
The builder leaseback period should not be treated as the permanent economic profile of the property. Investors should evaluate expected rent, expenses, financing, and marketability after the builder vacates.
- Current builder leaseback rent
- $4,150 / mo
- Estimated post-lease residential market rent
- $3,700 / mo
- Difference (builder rent vs. market rent)
- -$450 / mo
- Break-even rent at these assumptions
- $3,914 / mo
- Post-lease cushion above break-even
- -$214 / mo
- Estimated lease-up period
- 2 months
- Estimated lease-up carrying gap
- $7,400
- Estimated conversion / de-modelization cost
- $12,000
Renewal scenario
The builder extends under its option — in this example two six-month extensions at a 3% escalation — continuing contracted rent above the $3,914 break-even. Availability depends on remaining sales runway in the community.
Rental scenario
Convert to a residential rental at an estimated $3,700 per month after roughly $12,000 of conversion work and a 2-month lease-up gap. Residential operating costs (management, maintenance, vacancy) also return to the investor at that point.
Sale scenario
Sell into the resale market once the model is converted to retail finish, against a community that is further built out than it was at purchase. Selling costs and the upgrade premium's resale support both matter here.
Stress test the exit
The contracted term is the easy half. Switch scenarios to see what happens when post-lease market rent comes in light, the home sits vacant longer, conversion costs run over, operating costs rise, or values stay flat.
Builder rent through the term, market re-tenanting after with one month of lease-up, expenses as underwritten, 3% appreciation.
- 10-yr annualized return
- 9.4%
- Equity multiple
- 2.45×
- Total profit
- $235,294
- Post-lease frictions
- - $58,900
Simplified stress test for illustration. It layers the model-conversion cost, a lease-up gap, a permanent step-down from builder rent to market rent, and higher operating expenses onto the pro forma. Real outcomes depend on the actual lease, appraisal, financing and local market. Not investment advice.
Why this deal may not work
Every listing on Model Home Investor carries a section like this. A directory that only publishes upside isn't underwriting.
The appraisal may not support the purchase price
The asking price of $612,000 sits above the $589,000 median home value shown for the surrounding ZIP code. Heavily optioned models frequently price above neighborhood comparable sales, and a short appraisal reduces usable leverage or requires more cash at close.
The upgrade premium may not be supported by comparable sales
Model décor, structural options and landscaping can carry a premium a resale appraiser will not fully credit. Ask for the itemized option schedule and judge which items a future buyer or appraiser will actually pay for.
Post-lease residential rent is below builder leaseback rent
Estimated market rent of $3,700 per month is $450 below the $4,150 contracted rent — a 10.8% step-down when the builder leaves. If market rent softens further, the long-run yield falls with it.
Debt-service coverage provides only a modest cushion
DSCR of 1.08 against break-even rent of $3,914 per month leaves limited room for a tax reassessment, an insurance increase, or a rate change on refinancing. At the estimated post-lease rent the property does not cover operating expenses plus debt service at these assumptions.
Conversion costs may run higher than estimated
The $12,000 de-modelization estimate covers restoring the home to retail finish. Converted garages, removed closets, non-standard lighting, signage and hardscape can push this materially higher, and the lease language decides who pays.
Vacancy after the builder leaves may run longer than expected
The model assumes roughly 2 months of lease-up. Each additional vacant month costs approximately $3,700 of gross rent while operating expenses and debt service continue.
The income stream depends on a single tenant's credit
One corporate tenant carries the entire contracted income. The lease is only as strong as the signing entity and any parent guaranty behind it, and an early-termination right can shorten the term you underwrote.
These concerns are generated from the assumptions shown on this page. They are not a prediction, and they are not a recommendation for or against any investment.
Lease terms
- Lease structure
- Builder leaseback, NNN-style
- Initial term
- 24 months from close
- Renewal option
- Two 6-month extensions at 3% escalation
- Rent escalation
- 3% at month 13
- Maintenance & landscaping
- Builder (tenant) responsibility
- Utilities
- Paid by builder during model use
- Insurance
- Owner carries dwelling; builder carries liability
- Security deposit
- One month's rent
- Turnover condition
- Model conversion to retail finish at builder cost
- Earliest close
- 45 days from executed contract
What's renting nearby
Recently leased homes within two miles, used to sanity-check the leaseback rent against the open market.
| Address | Distance | Bd/Ba | Sqft | Monthly rent | Leased |
|---|---|---|---|---|---|
| 3910 Kestrel Loop | 0.4 mi | 4 / 3 | 2,512 | $3,995 | Jun 2026 |
| 12207 Marbella Way | 0.7 mi | 4 / 3 | 2,704 | $4,200 | May 2026 |
| 8815 Cypress Hollow Dr | 1.1 mi | 5 / 3 | 2,910 | $4,425 | May 2026 |
| 4471 Ashcombe Ln | 1.3 mi | 4 / 2.5 | 2,388 | $3,850 | Apr 2026 |
| 2260 Palmetto Ridge Ct | 1.6 mi | 4 / 3 | 2,640 | $4,100 | Apr 2026 |
| 7702 Verano Crest | 2.0 mi | 4 / 3 | 2,755 | $4,275 | Mar 2026 |
| Median comp rent | $4,150 | in line | |||
Location
Highland Reserve
Wesley Chapel, FL 33543
Tampa–St. Petersburg metro
- Interstate 753.2 mi
- Downtown Tampa27 mi
- Tampa International Airport34 mi
- Elementary school0.9 mi
- Grocery & retail center1.4 mi
- Regional hospital4.6 mi
Neighborhood & demographics
Rental demand, income, and growth signals within the surrounding ZIP code.
Population growth (5 yr)
+14.8%
Median household income
$96,400
Renter-occupied homes
27%
Avg days on market
31
Median 4-bed rent
$4,090
Rent growth (12 mo)
+3.9%
Median home value
$589,000
School rating (avg)
8 / 10
The community
Highland Reserve
Wesley Chapel, FL 33543 · Tampa–St. Petersburg metro
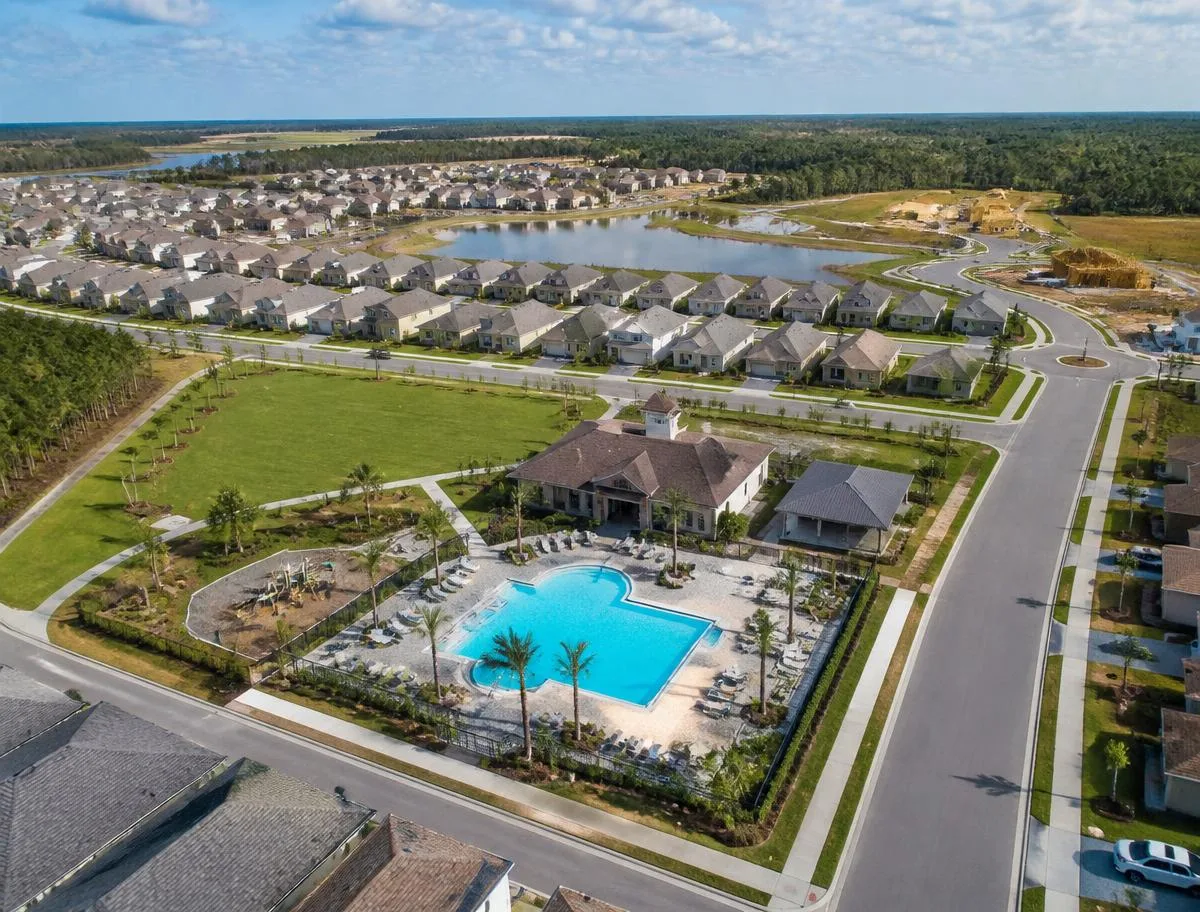
412 homesites with amenity center, resort pool, trails, and a park. Roughly 6 years of build-out remain, which is what keeps the model in service and the leaseback rent flowing. Model leasebacks can be single-family, townhome, or condo — this listing shows one example.
- Homesites412
- Build-out remaining~6 years
- HOA dues$95 / mo
- CDD / special district$1,780 / yr
- Home typeSingle-family detached — example
Property management
During the leaseback the builder maintains the home as its model, so day-to-day management is minimal. These are the options investors line up for the post-lease period.
Builder-maintained term
The builder covers upkeep, landscaping, and utilities while the home serves as its sales model.
Third-party manager
Engage a local residential property manager for lease-up after the builder vacates — typically 8% of collected rent.
Self-manage or resell
Take over directly, or sell into the retail market once the model conversion is complete.
Fictional example listing — not an actual property or investment opportunity. All property, builder and financial details shown are hypothetical. Model Home Investor is not a licensed broker or agent and does not represent any party. Verify all terms directly with the builder.